
Marketing Reporting & Business Intelligence
Construction Marketing Reporting & Business Intelligence
Stop guessing and start knowing. BuilderMate's construction marketing reporting and business intelligence give you real-time dashboards for revenue, pipeline, lead-source ROI, job costing, and team performance — the data-driven insight contractors need to grow.
- Construction marketing reporting & attribution
- Contractor marketing dashboard & conversion analytics
- Construction business intelligence reporting
- Profitability by project and type
- Sales pipeline analysis
- Custom construction reports for any question
Construction Marketing Reporting That Actually Moves the Business
Most construction software claims to offer "reporting" — what they really give you is a static export of yesterday's data. BuilderMate ships with real construction marketing reporting and construction business intelligence built on top of live CRM, estimate, invoice, job cost, and commission data. Your contractor marketing dashboard shows lead source ROI, cost-per-lead, estimate win rate, average deal size, sales rep leaderboards, and pipeline value — updated every time your team makes a move.
On the operations side, our construction business intelligence reporting gives you margin tracking per project, variance between estimate and actual costs, labor hour variance, subcontractor spend, outstanding AR, and upcoming cash flow. It's the builder conversion analytics and builder margin tracking stack most contractors pay a BI consultant to build in Power BI — included in every BuilderMate plan.
Complete Business Intelligence
Every metric you need to understand and grow your construction business
Real-Time Dashboards
Live dashboards showing revenue, pipeline, active projects, and key metrics at a glance.
Profitability Reports
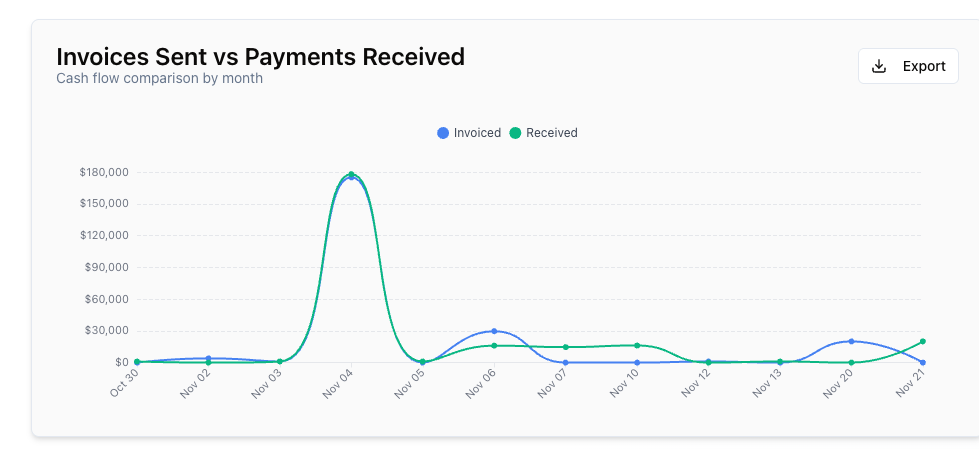
Track actual vs estimated costs, profit margins, and job profitability across all projects.
Pipeline Analysis
Visualize your sales pipeline with conversion rates, win probability, and revenue forecasting.
Job Costing
Compare estimated vs actual costs for labor, materials, and subcontractors on every project.
Revenue Tracking
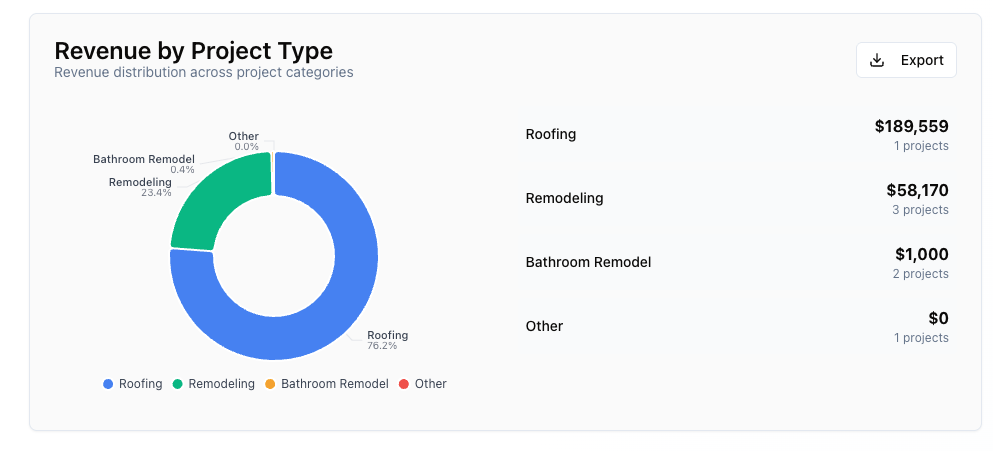
Track revenue by month, quarter, year, project type, or client with trend analysis.
Team Performance
Monitor individual and team performance with sales metrics, project completion, and productivity.
Cash Flow Reports
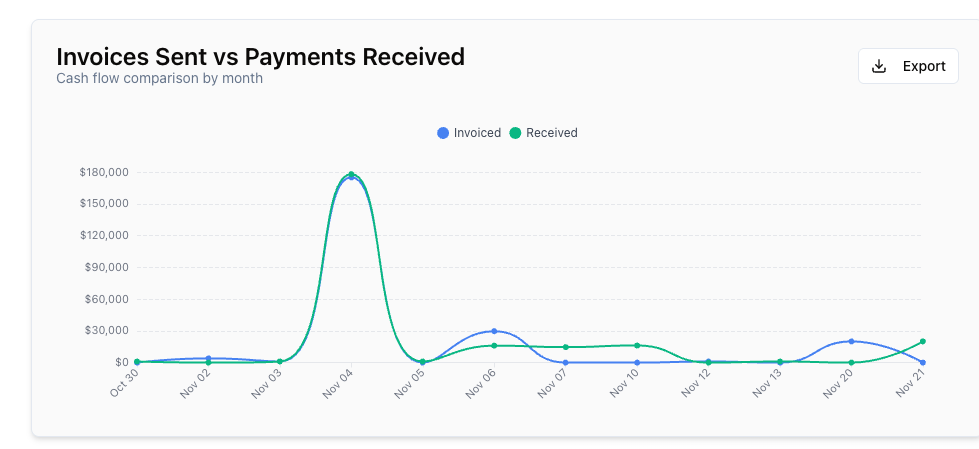
Track outstanding invoices, upcoming payments, and cash flow projections to manage finances.
Custom Reports
Build custom reports with filters, date ranges, and groupings to answer specific questions.
100+ Pre-Built Reports
Ready-to-use reports covering every aspect of your business
Financial Reports
- Profit & Loss by Project
- Revenue by Month/Quarter
- Outstanding Invoices
- Cash Flow Projection
- Expense Analysis
- Tax Preparation Reports
Sales Reports
- Pipeline by Stage
- Win/Loss Analysis
- Sales by Rep
- Lead Source ROI
- Estimate Conversion
- Revenue Forecast
Operations Reports
- Active Projects Status
- Project Timeline Variance
- Labor Hours by Project
- Material Cost Analysis
- Subcontractor Spending
- Change Order Summary
Team Reports
- Individual Sales Performance
- Commission Earned
- Time Tracking Summary
- Project Assignments
- Productivity Metrics
- Customer Satisfaction
Real Results from Business Intelligence
Identify Profit Leaks
Review profitability report and discover kitchen remodels consistently running 15% over budget on labor. Dig into job costing details and find specific phase taking too long. Adjust estimates and improve processes - increase kitchen remodel margins by 12%.
- Data-driven process improvements increase profitability
Optimize Sales Pipeline
Pipeline report shows leads from Facebook ads have 8% conversion vs 35% from referrals. Shift marketing budget from paid ads to referral incentive program. Increase overall conversion rate and reduce customer acquisition cost by 40%.
- Better marketing ROI with pipeline insights
Improve Cash Flow
Cash flow report reveals $45,000 in invoices over 30 days past due. Send automated payment reminders via SMS. Collect $38,000 in two weeks and implement stricter payment terms going forward.
- Better cash management prevents shortfalls
Frequently Asked Questions
“The reporting changed how we run our business. We discovered which project types are most profitable, which lead sources convert best, and where we were losing money. Used that data to increase our average profit margin from 18% to 26% in one year.”
Complete Your Toolkit
These features work great together with what you just explored.
Budget Tracking
Budgeted vs. actual cost reports for every project.
Learn moreProject Management
Project performance data feeds your reports.
Learn moreQuickBooks Integration
Financial data synced from QuickBooks enriches reports.
Learn moreCommission Tracking
Run commission reports by salesperson and period.
Learn moreReady to Make Data-Driven Decisions?
Join contractors using BuilderMate's reporting to increase profitability and grow faster.